
For site owners
Read your reports
What every number means, and the three worth acting on.
The reports screen answers one question: where is the money coming from, and where is it leaking away. This page says what each number means, how to stack the groupings so the table answers a real question, and which three findings are worth acting on.
Pick a period first

Nothing on the page means anything until you know which days it covers. The row sits at the top of the dashboard and the reports page, and your choice follows you between them. Custom opens a calendar for any two dates.
Today is a bad period to judge anything by. The day is not finished, so every rate on the page is being worked out from a handful of readings. Last 7 days is the shortest period worth an opinion.
All traffic or Paid only
Next to the period buttons is a switch. All traffic, the one it opens on, counts every view of your ad slots from the moment your tag goes live, whatever filled them: an advertiser's ad, your Advertise Here card, your own ad code or banner, or nothing at all. Paid only counts just the views an advertiser paid for.
Revenue is the same on both, because only paid views earn anything. What moves is everything worked out from the views: on All traffic your eCPM is what a thousand of all your views earned, on Paid only what a thousand paid views earned. The gap between the two is the part of your traffic still waiting for an advertiser.
The nine numbers across the top
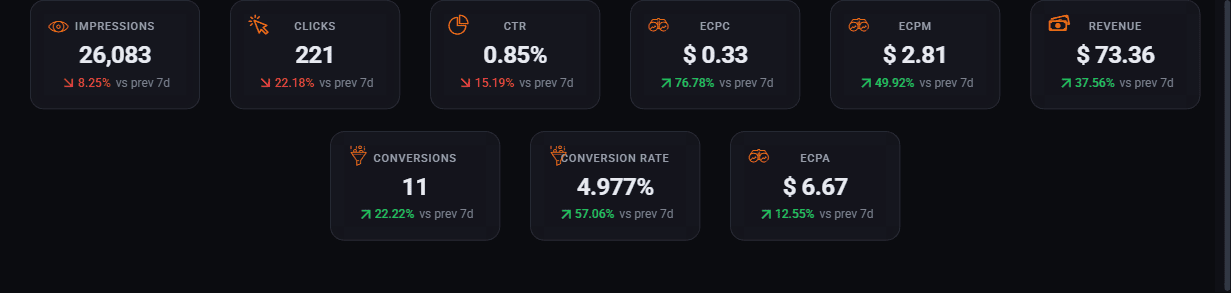
- Impressions
- How many times your ad slots were seen. One slot, seen once, by one person. On All traffic that is every view, whatever filled the slot; on Paid only, just the ads an advertiser paid for.
- Clicks
- How many of those were clicked.
- CTR
- Clicks divided by impressions, as a percentage. Between 0.5% and 1% is ordinary for a banner. Under 0.2% means the ad is being ignored, which usually means it is in a spot nobody looks at.
- eCPC
- What each click earned you on average.
- eCPM
- What a thousand views of your space actually earned you. The single most useful number on the page, because it compares a busy page against a quiet one fairly.
- Revenue
- Money. What the period actually earned.
- Conversions and conversion rate
- How many people did the thing the advertiser wanted after clicking, if the advertiser set up tracking for it. Often zero, because most do not.
- eCPA
- What your space earned per sale the advertiser made. Only meaningful when conversions are being tracked.
What the small e means
Three of those start with a lower case e, and it is not decoration. The e stands for effective, which means measured afterwards rather than asked for.
An advertiser sets a CPM: this is the most I will pay for a thousand views. You earn an eCPM: this is what a thousand views turned out to be worth, worked out from the money and the views once both had happened.
Same unit, opposite ends of the same transaction. Your floor price is a CPM because you are setting it. Everything on your reports is an eCPM because it is being measured.
The comparison underneath
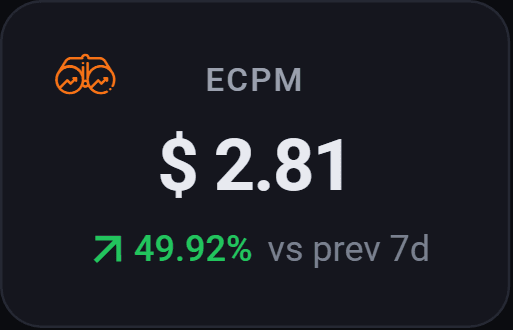
The small arrow compares against the previous stretch of the same length, so on Last 7 Days it is this week against last week.
If the previous stretch had none at all, there is no percentage to give, so the tile says New instead. You will see that in your first week, before there is a last week to compare with.
Green up on revenue is good. Green up on eCPM is better, because it means your space got more valuable rather than just busier. A week where revenue rose and eCPM fell means you had more traffic and were paid less for it, which is worth knowing before you congratulate yourself.
The chart
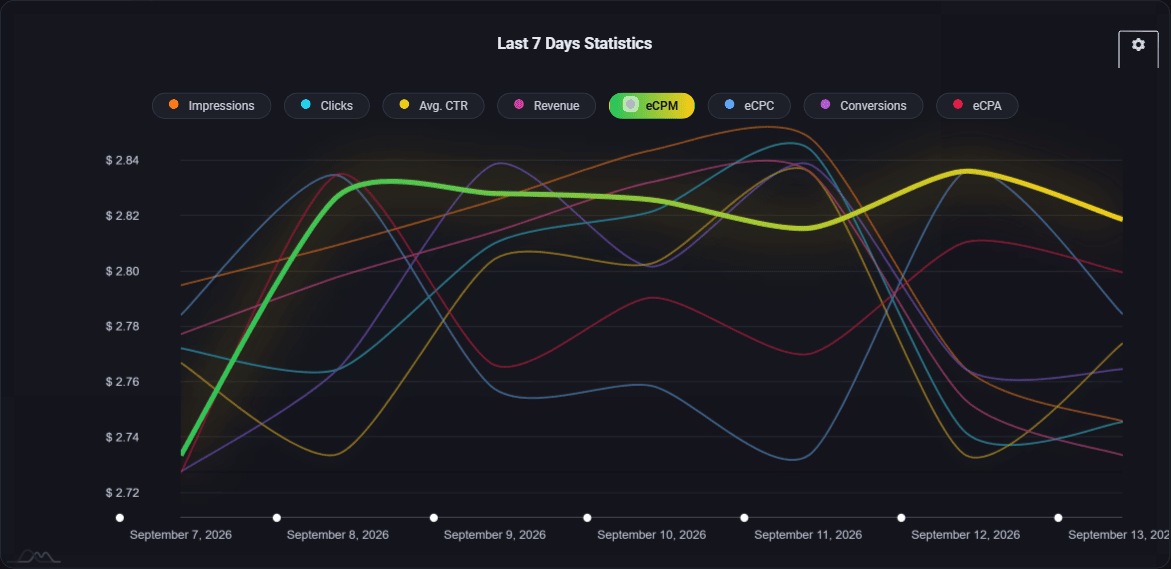
The labels above the chart are switches. Click one to add that line, click it again to take it away. Fewer lines is easier to read, and two at a time is plenty.
The most useful pairing is impressions and eCPM:
- Impressions steady, eCPM falling. Your traffic has not changed but what advertisers will pay for it has.
- Impressions falling, eCPM steady. You have a traffic problem, not an advertising one. Nothing on this screen will fix it.
- Both climbing. Leave everything alone.
The breakdown cards

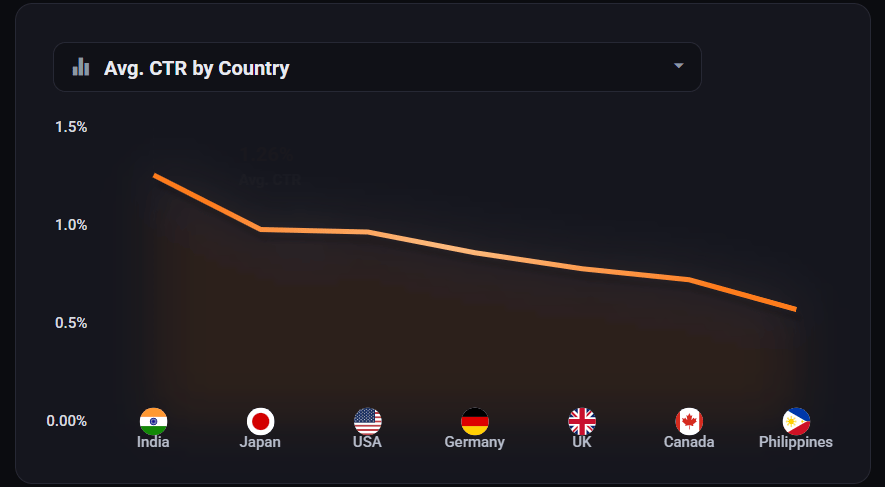
The picker above each card changes the measure. The cog at the top right changes the chart type and what it is grouped by, and it holds more options than the picker does.
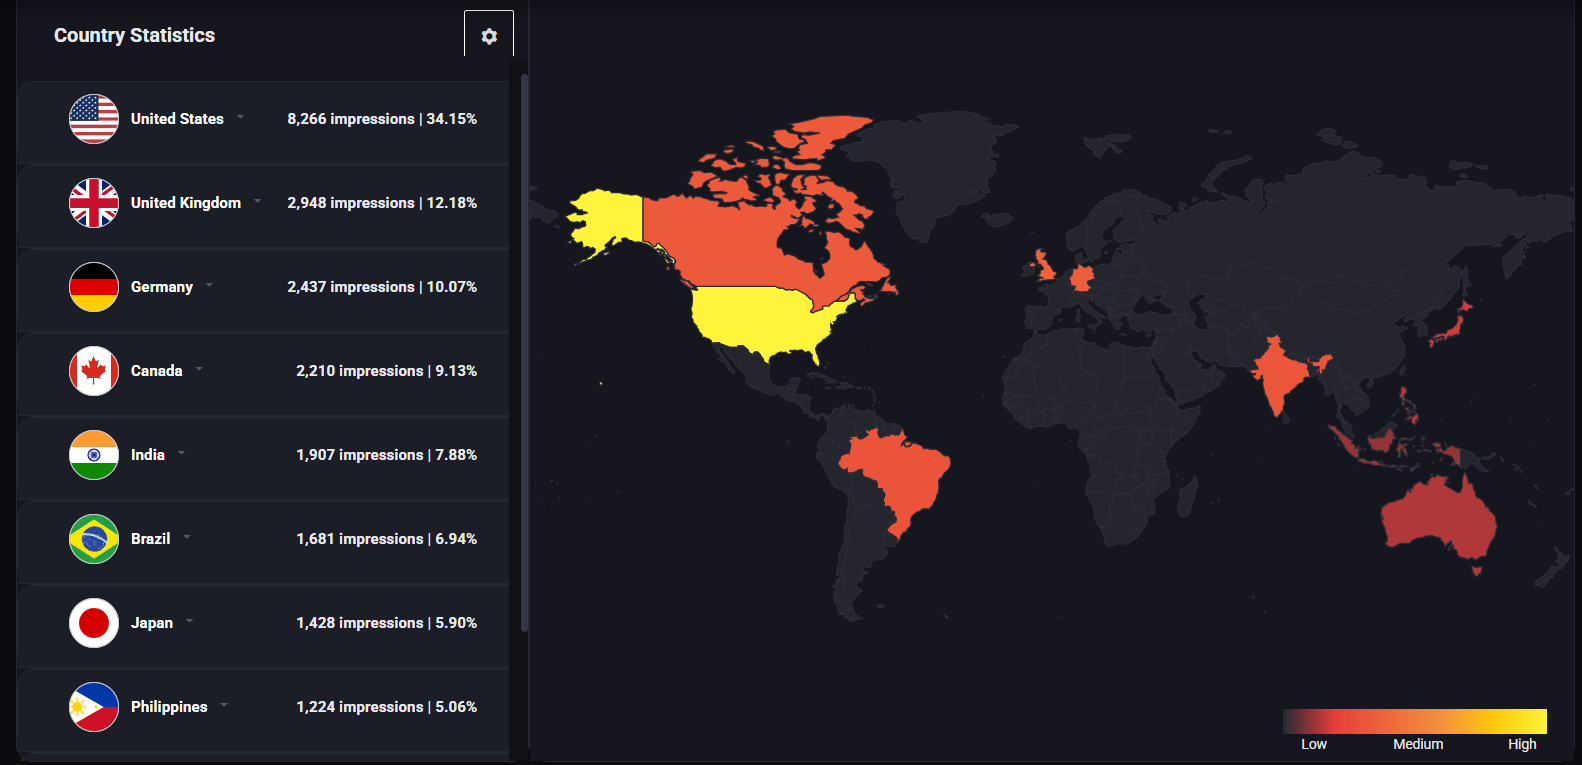
These cards are for noticing things, not for deciding them. When one of them looks odd, take the question to the table below.
The table, where the answers are
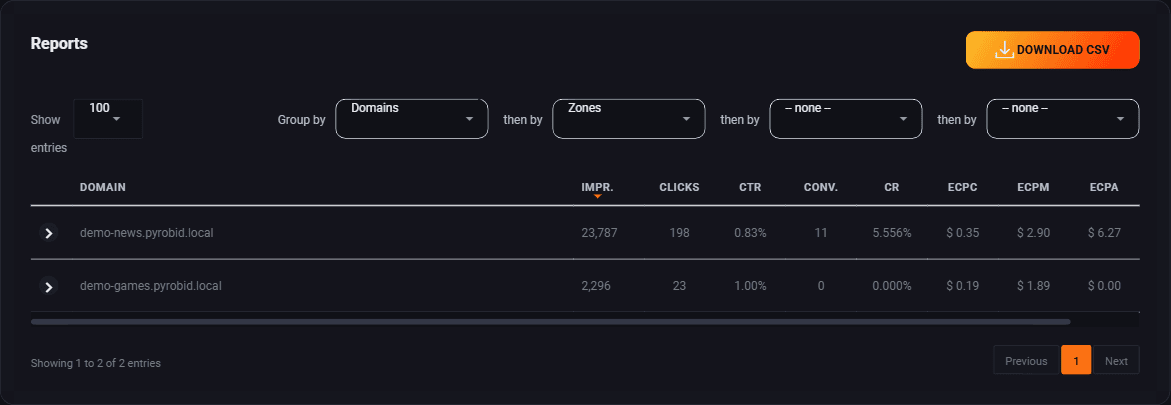
Group by changes what each row represents. Set it to Country and every row is a country. Set it to Zone and every row is one of your ad slots.
Then by, then by, then by
The three pickers after the first are the part most people never touch, and they are where the real answers live. They nest the table: group by Domains, then by Zones, and each site becomes a row you can open to see its slots underneath.

Some questions can only be asked this way:
| The question | Group by, then by |
|---|---|
| Which slot on which site is doing the work | Domains, then Zones |
| Is my sidebar slot worth more to American readers than to everyone else | Zones, then Countries |
| Does my leaderboard die on phones | Zones, then Devices |
| When did this slot stop earning | Zones, then Dates |
Four groupings that earn their keep
- Zone. Which of your slots is actually working. Almost always one earns most of the money and one earns almost nothing.
- Country. Traffic from some countries is worth many times more than from others. If most of your views come from somewhere that pays very little, that explains a low eCPM on its own.
- Device. Phone and desktop behave differently. A leaderboard that does well on desktop can earn nothing on a phone, because it does not fit.
- Date. For finding the day something changed.

Taking it away with you
Download CSV gives you the table exactly as you have it arranged, groupings and all, as a spreadsheet.
One zone at a time

On the Zones screen, clicking a zone name opens the same report for that zone alone. Same layout, so everything above still applies. It is the quickest way to answer whether a slot is worth keeping.
Three things worth acting on
- A zone with plenty of impressions and almost no revenue
- The slot is being filled by advertisers paying very little. Raise the floor price on that zone a little and watch whether revenue goes up or impressions collapse.
- A zone with almost no impressions
- Either nobody reaches that part of your page, or your floor price is above what anybody is bidding. Halve the floor for a few days. If impressions appear, it was the price. See Set your floor price.
- One country producing most of your views but little of your money
- Normal, not a fault. Every market is priced from your floor in the proportion the wider industry uses, and some markets are simply worth less. The choice there is between a few cents and nothing.
Give any change three or four days before judging it. Daily figures bounce around enough that a single day tells you very little, and two changes in one week tell you nothing about either.
A monthly routine that works
- Set the period to Last 30 days.
- Group by Zones. Sort by revenue. Look at the bottom of the list rather than the top.
- For each slot earning almost nothing, open it and check impressions. No impressions is a price problem. Plenty of impressions and no money is a placement problem.
- Group by Domains then Zones if you run more than one site, so a strong site is not hiding a weak one.
- Check your eCPM against last month. That one number tells you whether your space is getting more valuable.
Where to go next
- Set your floor price, which is what most of these findings send you back to.
- What shows when nothing sells, for the impressions that are not earning.
Run all of this on your own site.
Every screenshot above is the real product. Your advertisers see the same screens under your brand, and on your own domain from the Pro plan.
Start free trial14 days free. Your existing ads keep running. Cancel anytime.