
For advertisers
Read your campaign numbers
What every tile and column means, and the three worth acting on.
There are a dozen numbers on your dashboard and fifteen columns on your campaign list. Most of them you will never act on. This page says what each one is, and then which three actually decide anything.
Pick a period first

Nothing below means anything until you know which days it covers. The row sits at the top of the dashboard, campaigns and reports, and it remembers your choice as you move between them. Custom opens a calendar for any two dates.
Today is a bad period to judge anything by. The day is not finished, so every rate on the page is being worked out from a handful of readings. Last 7 days is the shortest period worth an opinion.
The tiles
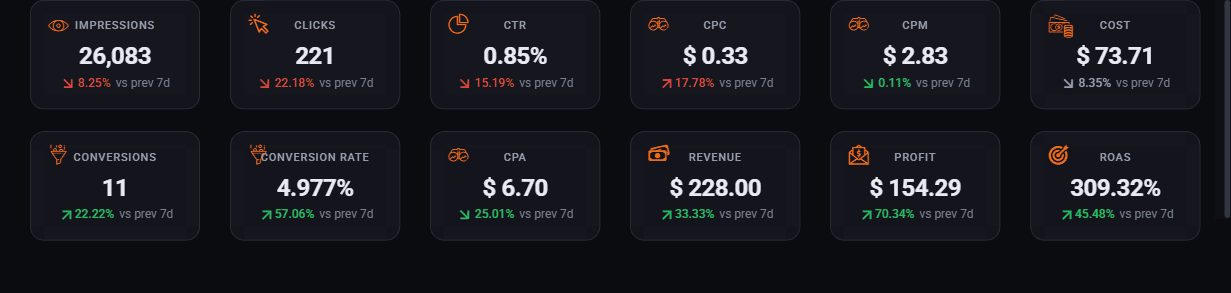
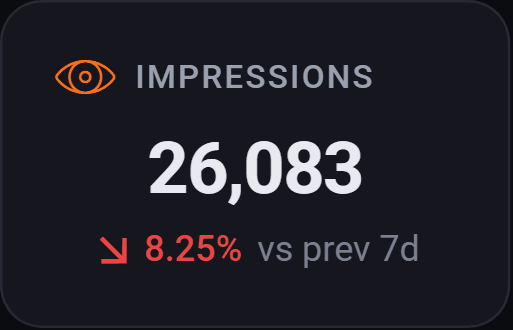
The small figure underneath compares against the previous stretch of the same length, so on Last 7 Days it is this week against last week. Green up is not always good, and red down is not always bad: a rising CPC means you are paying more per visitor.
| Tile | What it is |
|---|---|
| Impressions | How many times your ad was drawn on a page. |
| Clicks | How many times somebody clicked it. |
| CTR | Clicks divided by impressions. How interesting the ad is. |
| CPC | What each click cost you on average. |
| CPM | What a thousand impressions cost you on average. |
| Cost | Money spent in this period. |
| Conversions | Sales, if you set up the conversion pixel. |
| Conversion rate | Share of clicks that turned into a sale. |
| CPA | What each sale cost you in ad spend. |
| Revenue | Conversions multiplied by the conversion value you set. |
| Profit | Revenue minus cost. |
| ROAS | Return on ad spend. Revenue as a percentage of cost. |
The last six are only real if you set up conversion tracking. Without it, revenue is zero, profit is a negative number the size of your spend, and ROAS is meaningless. That is not a fault, it is the system telling you it has no idea what a sale is worth to you.
The chart
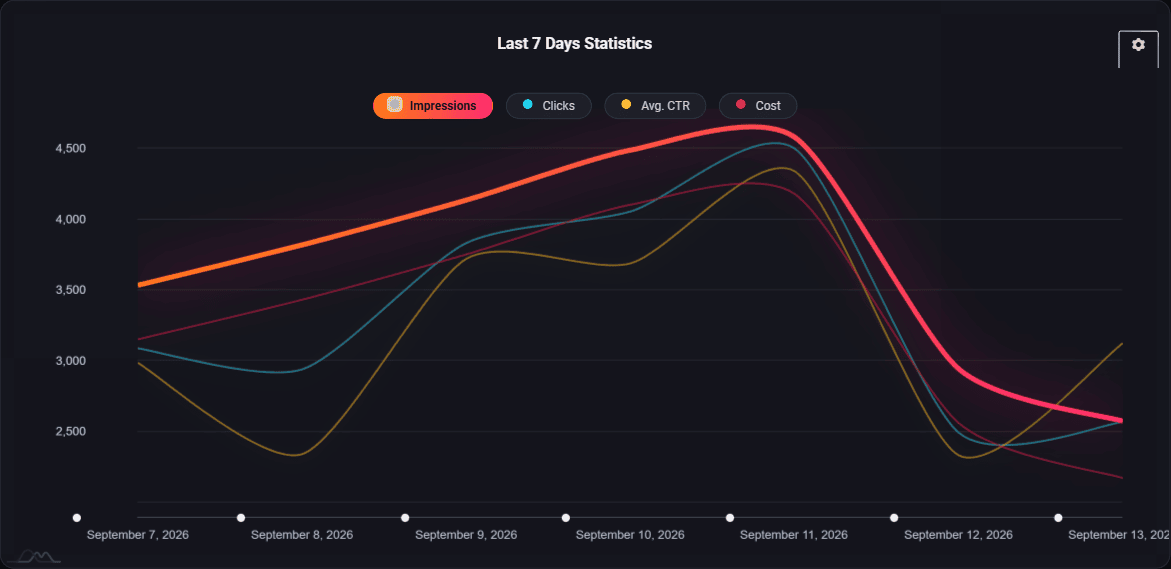

Click any chip in the legend to make that line the bold one. The cog at the top right of the card changes which measures are plotted at all.
What you are looking for here is shape, not values. A line that falls off a cliff usually means a budget ran out or a campaign was paused. A line that climbs steadily usually means a bid increase working through.
The breakdowns
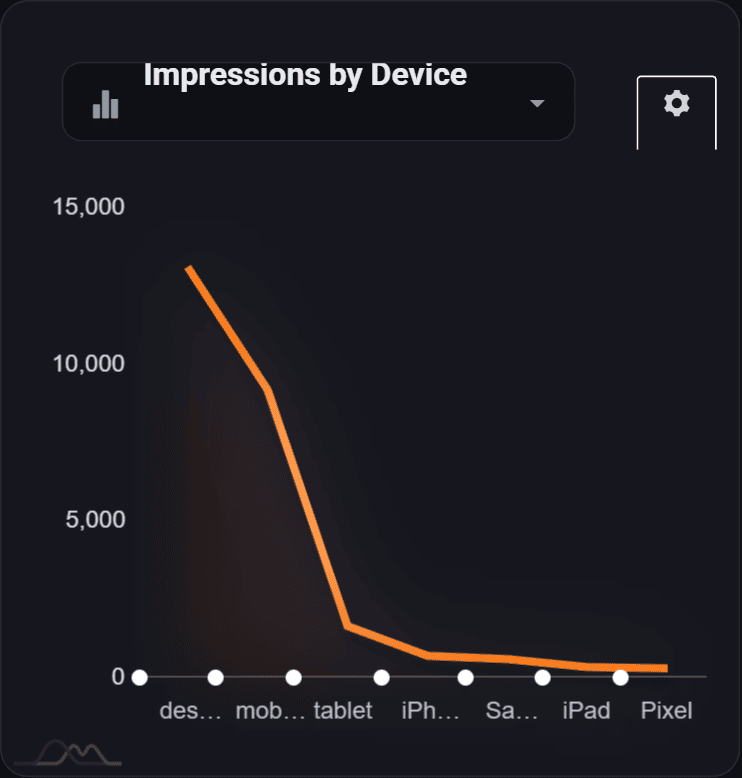
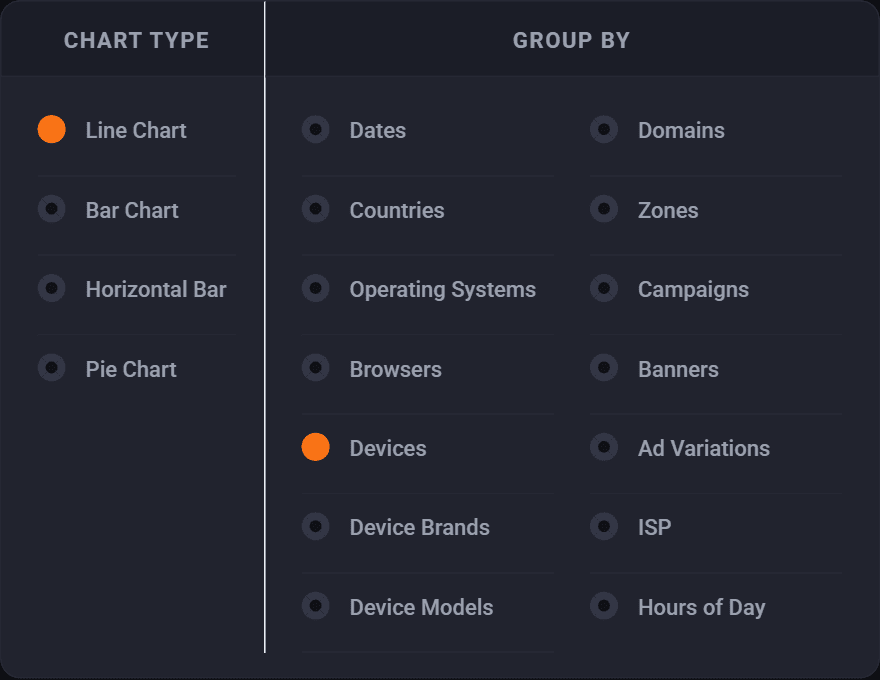
The three smaller cards below the chart split the same period by device, by network and by country. The picker above each one changes the measure. The cog changes the chart type and what it is grouped by, and it holds more options than the picker does.
The campaign list


Two columns here are not on the dashboard. Daily budget and Bid can be edited in place: click the value, type a new one, press enter. That is the fastest way to raise a bid on a campaign that is not moving, without opening the whole wizard.
Reports, where the real answers are

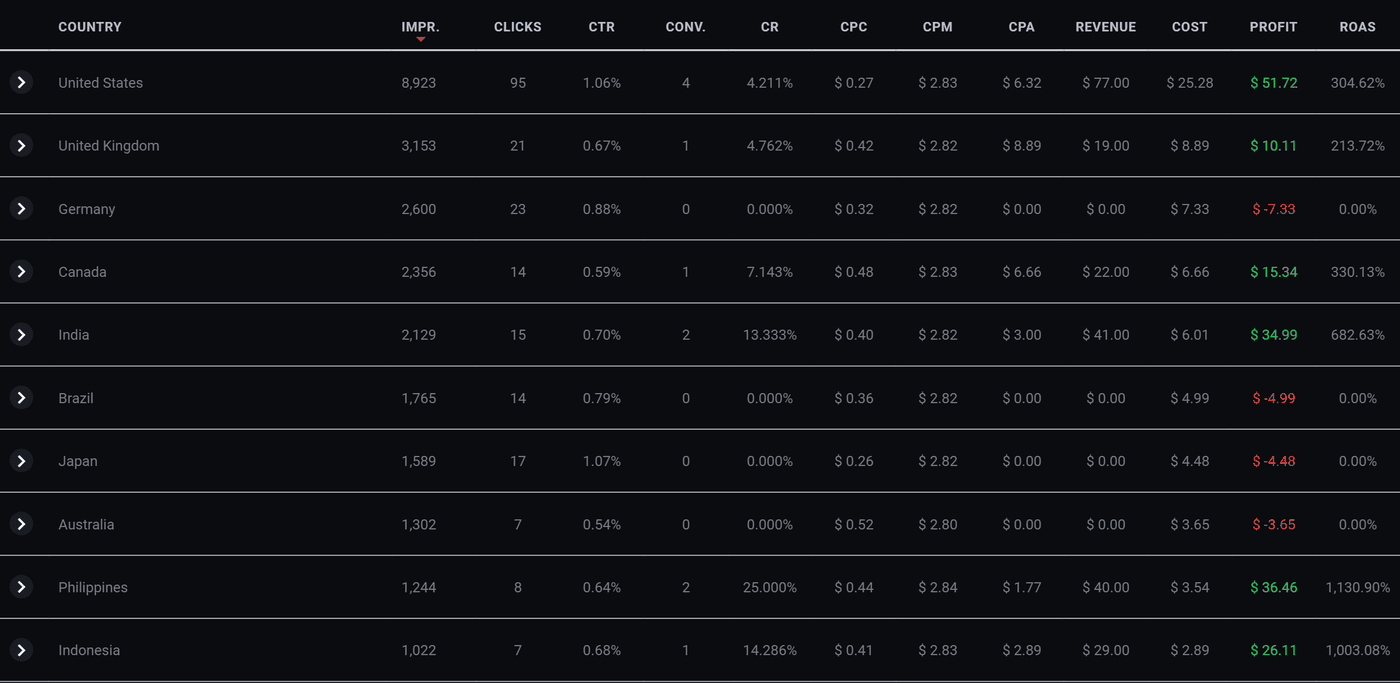
The dashboard tells you how things are going. Reports tell you why. The Group by picker is the whole point of the page: the same numbers, split by dates, countries, regions, cities, operating systems, browsers, devices, device brands and models, domains, zones, campaigns, banners, ad variations, network or hour of day.

The three numbers that decide things
Everything above is context. These three are the ones you act on.
CTR, when you are judging the ad
CTR is about the artwork and the offer, nothing else. A poor CTR is not fixed by raising a bid or changing targeting. It is fixed by a different banner. Run two and compare.
CPA, when you are judging the campaign
If a sale is worth $40 to you and your CPA is $12, the campaign works and you should spend more. If the CPA is $60, it does not, however good the CTR looks. This is the number that decides whether to keep going.
Impressions, when nothing is happening at all
Near zero impressions is never a creative problem. It is a bid, a budget, a schedule or a targeting filter. See Why is my ad not running.
A weekly routine that works
- Set the period to Last 7 days.
- Open Reports and group by Zone. Turn off anything spending real money with no conversions.
- Group by Country. Same question.
- Group by Hour of Day if you have enough data. If your clicks all land in a six hour window, set active hours to that window and stop paying for the rest.
- Look at CPA against what a sale is worth. Raise budgets where it is comfortably under, pause where it is over.
Twenty minutes a week, and it will do more for a campaign than any amount of staring at the dashboard.
Run all of this on your own site.
Every screenshot above is the real product. Your advertisers see the same screens under your brand, and on your own domain from the Pro plan.
Start free trial14 days free. Your existing ads keep running. Cancel anytime.